
The U.S. continued a trend of reducing the number of bridges rated poor between 2020 and 2021. However, the number of good rated bridges also dropped.
For the past several years, bridges rated fair have made up the largest segment of the nation’s bridge inventory, and it’s a growing category, indicating that states continue to lose ground on maintenance.
![]() Welcome to the Better Roads Bridge Inventory, an annual survey conducted since 1979 to examine the condition of our nation’s bridges. This year, departments of transportation in 38 states responded between October 16 and December 17 to the annual Equipment World survey. The survey was sent to the bridge engineering divisions of all 50 states and the District of Columbia.
Welcome to the Better Roads Bridge Inventory, an annual survey conducted since 1979 to examine the condition of our nation’s bridges. This year, departments of transportation in 38 states responded between October 16 and December 17 to the annual Equipment World survey. The survey was sent to the bridge engineering divisions of all 50 states and the District of Columbia.
States were asked to report the number of bridges rated good, fair and poor in their states. We also asked them to report the total amount of bridge deck area in their states and what percentage is rated poor, among other questions.
For states that did not respond, we used the Federal Highway Administration’s 2021 Bridge Inventory data.
What follows are some snapshots from the survey, ranking the states in various categories. At the end of the article, we provide a detailed look at overall conditions of the bridges in each state, so you can see how your state stacks up.
Bridge condition ratings
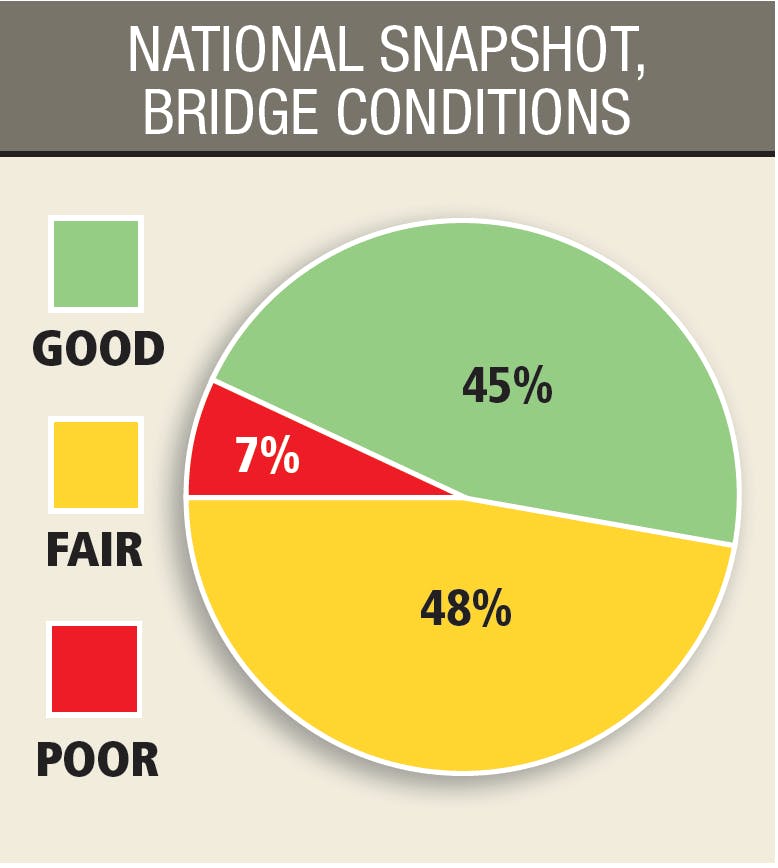 Overall percentages of U.S. bridge ratings for 2021.Equipment WorldBefore we delve into the state bridge rankings, let’s take a look at what the ratings mean.
The Federal Highway Administration asks states to rate bridges that are 20 feet or longer as “Good,” “Fair” or “Poor.”
GOOD – Bridges in this category range from excellent to some minor problems.
FAIR – Ranging from bridges with structural elements showing some minor deterioration, to bridges in which all primary structural elements are sound but may have minor section loss, cracking, spalling or scour; and may include minor erosion on bridge piers.
POOR – There are five categories of poor bridges:
- Poor – Advanced corrosion, deterioration, cracking or chipping. Also significant erosion of concrete bridge condition piers.
- Serious – Loss of section, deterioration, spalling or scour have seriously affected primary structural components. Local failures are possible. Fatigue cracks in steel or shear cracks in concrete may be present.
- Critical – Advanced deterioration of primary structural elements. Fatigue cracks in steel or shear cracks in concrete may be present or scour may have removed substructure support. Unless closely monitored, it may be necessary to close the bridge until corrective action is taken.
- Imminent Failure – Major deterioration or section loss present in critical structural components, or obvious loss present in critical structural components, or obvious vertical or horizontal movement affecting structural stability. Bridge is closed to traffic, but corrective action may be sufficient to put the bridge back in light service.
- Failed condition – Bridge is out of service and beyond corrective action.
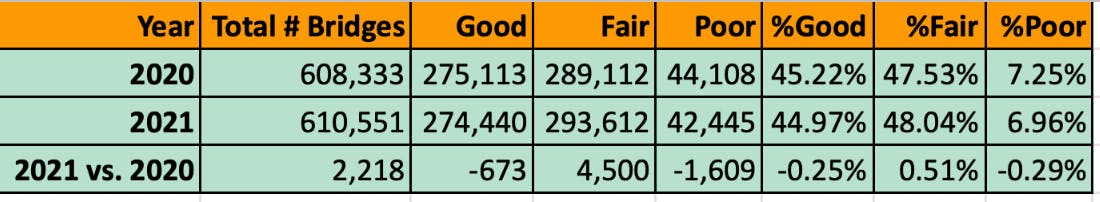 A breakdown of national bridge ratings, comparing the 2020 Better Roads Bridge Inventory to the 2021 inventory.Equipment WorldRanking the states
Note: An * beside a state indicates that 2021 FHWA National Bridge Inventory data were used.
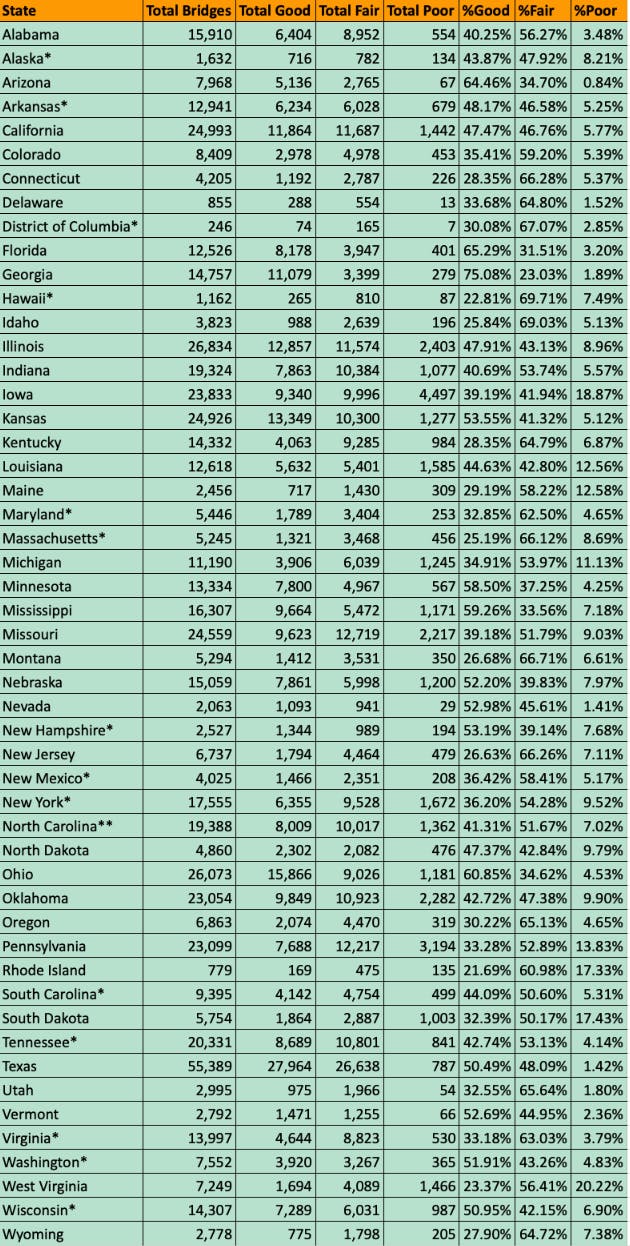
States with the lowest percentage of poor rated bridges
- Arizona – The state continues to hold the top spot with the lowest percentage of bridges rated poor at 0.84%. That’s a decline from 1% in 2020.
- Nevada – Rose slightly to 1.41% from 1.3% in 2020, but still holds second place.
- Texas – Reduced poor bridges to 1.42% from 1.5% in 2020, remaining in third place.
- Delaware – Rose from fifth to fourth place, with 1.52% of bridges rated poor. That’s down from 1.9% in 2020.
- Utah – Dropped from fourth to fifth place with 1.8% poor, which is the same as 2020.
States with highest percentage of bridges rated poor
- West Virginia – One-fifth of the bridges in the state (20.22%) are rated poor. That’s a slight drop from 2020’s 21%, but not enough to raise it from being the state with the highest percentage of poor rated bridges in the country.
- Iowa – Maintains its position at second-highest with a slight drop from 19.1% to 18.87%.
- South Dakota – Dropped in the rankings from fourth-highest in 2020 with 17.7% of bridges rated poor to third-highest. The state reported 17.43% of its bridges rated poor in 2021.
- Rhode Island – The state continues its rise from last place, where it ranked in 2019 and for many years prior. In 2020, it moved up to third-highest, and this year it has risen to fourth-highest, at 17.33%. That’s a drop from 18.4% in 2020.
- Pennsylvania – The state continues to reduce its number of poor rated bridges, but not enough to raise its rank in this category. It reported 13.83% of its bridges rated poor, which is a drop from 14.6% in 2020.
States with the highest percentage of bridges rated good
- Georgia – The state moves into the top spot at 75% of its bridges rated good, rising from fourth place in 2020 when 62.3% of its bridges were rated good.
- Florida – Drops from first place to second, with 65.29% of its bridges rated good, a slight drop from 2020.
- Arizona – Drops from second to third place, with 64.46% of its bridges rated good, which is up from 63.9%.
- Ohio – Rises from fifth place to fourth, with 60.85% of its bridge rated good, up slightly from 60.4%.
- Mississippi – Drops from third to fifth place, with 59.26% of its bridges in good condition, down from 62.77%.
States with lowest percentage of bridges rated good
- Rhode Island – 21.69%
- Hawaii* – 22.81%
- West Virginia – 23.27%
- Massachusetts* – 25.19%
- Idaho – 25.84%
States with highest percentage of bridges rated fair
- Hawaii* – 69.71%
- Idaho – 69.03%
- District of Columbia* – 67.07%
- Montana – 66.71%
- Connecticut – 66.28%
States with lowest percentage of bridges rated fair
- Georgia – 23.03%
- Florida – 31.51%
- Mississippi – 33.56%
- Ohio – 34.62%
- Arizona – 34.7%
States with lowest percentage of bridge deck rated poor
- Utah – 0.86%
- Georgia – 1.02%
- Arizona – 1.03%
- Texas – 1.13%
- Delaware – 1.26%
States with highest percentage of bridge deck rated poor
- District of Columbia* – 34.21%
- Rhode Island – 19.47%
- West Virginia – 14.51%
- Illinois – 12.21%
- Massachusetts* – 11.27%
See how your state compares
Below are a series of charts to give a broader look at the nation’s bridge inventory as derived from the Better Roads Bridge Inventory and 2021 FHWA National Bridge Inventory data:
Ranking all states by percentage of good, poor and fair bridges
 * Source: 2021 FHWA National Bridge Inventory data
** Includes culvertsEquipment World
Ranking all states by percentage of bridge deck area rated poor
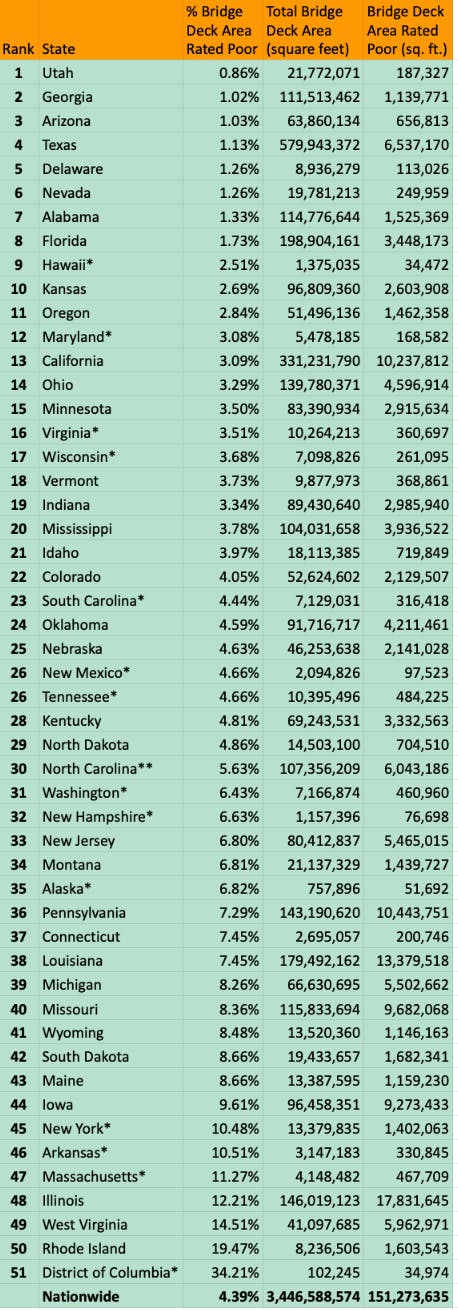 * Source: 2021 FHWA National Bridge Inventory
** Includes culvertsEquipment World
A detailed look at all of the states’ bridge ratings
 * Source: 2021 FHWA National Bridge Inventory
** Includes culvertsEquipment World